LANE REGIONAL AIR PROTECTION AGENCY
REQUEST FOR REDESIGNATION TO ATTAINMENT
AND MAINTENANCE PLAN FOR EUGENE/SPRINGFIELD PM10
TABLE OF CONTENTS
Introduction ……………………………………………….. 3
Demonstration of Attainment ……………………………... 6
Maintenance Plan …………………………………………. 10
Appendix A – LMP Qualification Analysis ……………….. 14
Appendix B – Home Wood Heating Ordinances …………... 20
Appendix C – 2008 Emission Inventory …………………… 30
Appendix D – Relationship of PM10 to PM2.5 ……………… 39
Appendix E – EPA PM10 Transportation Conformity …….... 43
Appendix F – 2009 HWH Survey ………………………….. 45
Introduction:
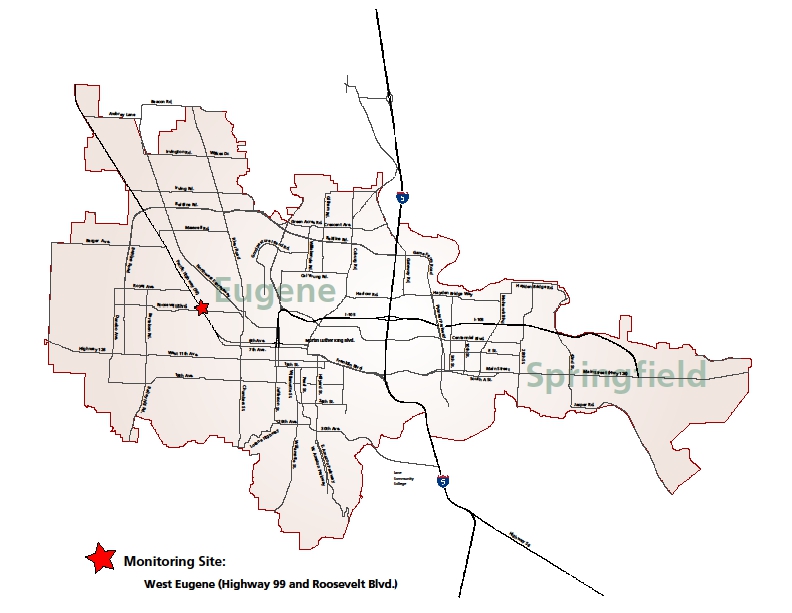
On August 7, 1987, the federal Environmental Protection Agency (EPA) categorized areas of the Nation into three groups based upon the likelihood that the area would violate the PM10 National Ambient Air Quality Standard (NAAQS) and the existing State Implementation Plan (SIP) would require revision in order to protect the PM10 NAAQS. Group I Areas were those having a 95% certainty of violating the PM10 NAAQS. Group II Areas were those having a 20 % to 95% probability of violating the PM10 NAAQS. The remaining areas below 20% probability were classed as Group III. Based upon the available ambient data, the area within the Eugene-Springfield Urban Growth Boundary (UGB) was classified by the EPA as a Group I Area. This area is defined in Oregon Administrative Rules 340-204-0010 (see Figure 1).
In response to this action, Lane Regional Air Protection Agency (LRAPA) adopted a SIP amendment in 1990 and an addendum in 1991 to address the new requirements of the federal Clean Air Act Amendments of 1990. These were subsequently adopted by the Oregon Environmental Quality Commission (EQC) and were submitted as an attainment plan to the EPA in November 1991 (see 59 FR 434870). This plan demonstrated attainment of the PM10 NAAQS by December 31, 1992, and demonstrated maintenance of the PM10 NAAQS through the year 2000. This plan was approved by the EPA in August 1994 (see 59 FR 434870 August 24, 1994). EPA also approved PM10 control strategies in the SIP as Reasonably Available Control Technology and Reasonably Available Control Measures (RACT/RACM).
LRAPA has continued to implement the control strategies defined in the SIP and the
UGB has not exceeded the 24 hour PM10 NAAQS since 1987. The annual PM10 NAAQS has never been exceeded. Based upon the monitoring data and the intent to maintain the current control strategies, it has been LRAPA=s intent to officially request redesignation of this area to attainment. For this to occur, the federal Clean Air Act requires LRAPA to develop a maintenance plan for which EPA requires dispersion modeling and projections of emissions 10 years into the future. This effort would place an excessive burden on LRAPA=s limited resources. In addition, the NAAAQS have undergone significant changes over the years with new particulate standards being added and subsequent lawsuits. This process was not finally resolved until 2006. As a result, LRAPA has delayed formally requesting redesignation.
Figure 1
Eugene/Springfield Urban Growth Boundary
The EPA has also issued guidance to streamline the process to redesignate an area from Anon-attainment@ to Aattainment@ for PM10 NAAQS. This new option was termed a Limited Maintenance Plan (LMP). It will allow areas which clearly meet the standards to effectively redesignate without using dispersion modeling and without projecting future emissions. LRAPA has chosen to use this option to prepare a maintenance plan and request redesignation for the Eugene-Springfield UGB to attainment for PM10.
According to EPA guidance, to qualify for the LMP option an area should meet the following criteria:
1. The area should attain the NAAQS.
2. The average 24 hour PM10 design value for the area based upon
recent 5 years of data should not exceed 98 ug/m3 (micrograms per cubic meter) and the annual design value should not exceed 40 ug/m3. (The annual PM10 NAAQS was revoked by the EPA on December 18, 2006.)
3. The area should expect only limited growth in on-road motor vehicle PM10
emissions.
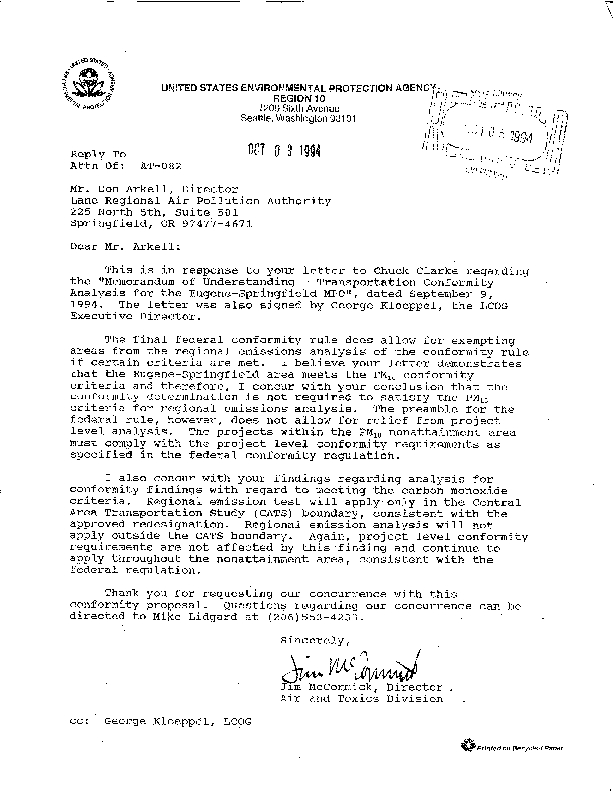
As detailed in Appendix A, this area clearly attains the NAAQS, and the design values are well below the defined limits. In addition, although the existing SIP for this area (confirmed by October 3, 1994, correspondence from EPA Region 10 ) demonstrates that motor vehicles are not a significant contributor to PM10 emissions in this area, a regional analysis of on-road motor vehicle PM10 emission was performed (see Appendix A) and demonstrated only limited growth in emissions. As a result, this area qualifies for the LMP option.
LRAPA has prepared this LMP for PM10 to demonstrate attainment with the PM10 NAAQS, provide a maintenance plan to assure continued attainment, and formally request redesignation of the UGB to attainment for the PM10 NAAQS.
Demonstration of Attainment:
On July 1, 1987, the EPA revised Title 40, Part 50 of the Code of Federal Regulations (40 CFR 50), which changed the particulate matter NAAQS from total suspended particulate to particulate matter less than or equal to 10 microns in size (PM10). The primary and secondary NAAQS for PM10 are as follows:
24 hour Standard: The NAAQS for PM10 is 150 ug/m3 for a 24 hour average
concentration. The standard is not to be exceeded more than once per year on average over 3 years, as determined in accordance with 40 CFR 50.
Annual Standard: The annual NAAQS for PM10 is 50 ug/m3 for an annual
arithmetic mean. The standard is attained when the expected
annual arithmetic mean concentration is less than or equal to
50 ug/m3, as determined in accordance with 40 CFR 50.
(This standard was revoked on December 18, 2006)
Since PM10 monitoring began in 1984, the UGB has exceeded the 24 hour NAAQS on 15 occasions, 12 of which occurred during an extensive period of cold temperatures and poor ventilation in December of 1985. The last exceedance of the 24 hour standard occurred in January of 1987. The 24 hour standard exceedances have all occurred during the Winter months. The annual standard has never been exceeded. Based upon the historical ambient monitoring data, the UGB was found to be in violation of only the 24 hour PM10 standard .
The original PM10 attainment plan was adopted by LRAPA in March 1990. Since adoption was prior to the CAA amendments of 1990, an addendum to the plan incorporating a contingency plan (as required by the 1990 CAA amendments) was adopted by LRAPA in October 1991. The amended plan was submitted to EPA in November, 1991. The EPA approved the plan in October 1994.
The analysis used to develop the plan indicated that on a worst case winter day (when exceedances were likely to occur) residential wood combustion emissions contributed 68% of the total local emissions into the airshed . The dispersion modeling analysis used to develop the plan demonstrated that on those poor air quality days, residential wood combustion emissions contributed over 90% of the ambient impact. As a result, it was determined that the mandatory curtailment of residential wood combustion emissions would be necessary and sufficient to achieve attainment. PM10 emission reductions from other sources were not needed. Preceded by a voluntary program that began in 1986, the mandatory curtailment plan began in November, 1991. Each of the jurisdictions within the UGB enacted ordinances prohibiting the use of solid - fuel space heating devices under certain conditions (see Appendix B). Enforcement of the ordinances has been delegated by Lane County, the City of Eugene, and the City of Springfield to LRAPA. The program consists of a multi-stage advisory issued daily each winter from November 1 through the end of February. The daily determination of which stage to initiate is based upon forecast meteorology and air quality. During good air quality conditions, a Agreen@ advisory which allows residential wood combustion is issued. If conditions are deteriorating, a yellow advisory which requests voluntary curtailment of the practice is issued. If PM10 levels are forecast to be near or exceed the standard, a red advisory prohibiting the practice (with an exemption for economic need) is issued. Since the mandatory program began, it has not been necessary to issue a red advisory and the PM10 standard has not been exceeded. The mandatory home wood heating curtailment program is considered to be RACM and is permanent and enforceable (see 59 FR 163 8/24/94).
LRAPA currently maintains a PM10 monitoring network which includes one site within the UGB (see Figure 1). This site meets the federal monitoring requirements contained in 40 CFR 58. As demonstrated by the historical monitoring data, and confirmed by a saturation monitoring study conducted by LRAPA in 1989, the HWY 99 site (# 410390058) measures the highest PM10 concentrations within the UGB. As depicted in the following table, the 24 hour concentrations at this site over a recent 9 year period remain well below the PM10 NAAQS of 150ug/m3.
Table 1
HWY 99 Site # 410390058
24 Hour PM10 Concentration (ug/m3)
Year annual high annual 2nd high 3 yr 2nd high
2000 73 50 ---
2001 65 61 ---
2002 66 62 66
2003 45 44 65
2004 59 40 62
2005 50 43 50
2006 68 53 59
2007 78 69 69
2008 56 48 69
The annual levels are also well below the former PM10 NAAQS of 50 ug/m3.
Table 2
Hwy 99 Site # 410390058
Annual Mean (ug/m3)
Year Annual Mean
2000 19
2001 19
2002 19
2003 19
2004 17
2005 17
2006 19
2007 16
2008 17
The monitoring data clearly demonstrates attainment with the PM10 NAAQS in accordance with 40 CFR 50.
Maintenance Plan:
EPA=s Limited Maintenance Plan Option (LMP) permits states to submit streamlined maintenance plans for areas that meet qualifying criteria. This option is specifically designed to redesignate areas that are at little risk of violating the PM10 standard. Areas qualifying for the LMP must meet the following criteria:
1. The area should attain the NAAQS
2. The average 24 hour PM10 design value for the area based upon 5 years of
data should not exceed 98 ug/m3, and the annual design value should not
exceed 40 ug/m3.
3. The area should expect only limited growth in on-road motor vehicle
PM10 emissions.
The detailed analysis of the LMP criteria is contained in Appendix A. This analysis clearly demonstrates attainment with the NAAQS. The 24 hour design value of 66 ug/m3 is well below the criteria level of 98 ug/m3 and the annual design value of 17ug/m3 is well below the criteria level of 40 ug/m3. In addition, the motor vehicle emission analysis demonstrates only a minimal increase in emissions. As a result, this area is qualified to submit an LMP.
Annual and 24 hour PM10 emission inventories of significant sources were developed for the 2008 attainment year. As required in the LMP option, 2008 is within the five most recent years of monitoring data used to determine whether or not the area meets LMP option qualifying criteria. The methodology used and the details of the calculations for each source category are found in Appendix C. In each case, EPA approved methods were used. As summarized in Table 3, residential wood combustion remains the primary source of PM10 on winter days, while point sources dominate the annual emissions.
Table 3
2008 Estimated PM10 Emissions for the Eugene/Springfield UGB
Source Annual (tons/year) Winter Day (tons/day)
Point Sources 1,624.1 4.4
Residential wood combustion 728.2 8.5
Road Dust 281.2 0.8
Motor vehicle exhaust, 120.3 0.4
brake and tire wear
Total 2,753.8 14.1
In the 1985 base year emission inventory developed for the 1990 SIP 7,051 tons of PM10 were emitted while in the 2008 annual E.I. only 2,754 tons were emitted. There has been a 61% reduction in annual PM10 emissions since 1985. In 1985 the 24 hour Winter day emissions were estimated at 31.4 tons, while in 2008 this estimate was only 14.1 tons, a 55% decrease in PM10 emissions. Although a quantitative explanation for all of the decline is not available, it is readily apparent that the precipitous decline in the wood products industry has drastically reduced the point source emissions. The lack of logging activity has also reduced the availability of cord wood. In addition, some older uncertified woodstoves and inserts have been replaced with cleaner burning more efficient certified woodstoves and inserts. Public awareness of the daily woodburning advisories has also resulted in less wood burning. As a result, residential wood combustion has been drastically reduced. In 1985, 85,325 tons of cord wood were burned in the UGB while in 2008 the estimate is 50,609 tons, a 41% reduction.
LRAPA has relied upon a mandatory residential wood combustion curtailment program to attain and maintain compliance with the PM10 NAAQS. This program has been successfully implemented within the UGB. It is the intent of LRAPA to continue to implement this program to ensure continued attainment with the ambient standards. Since this area qualifies for the LMP option, maintenance of the ambient standard is presumed to be satisfied.
LRAPA has recently implemented the following additional control measures to ensure that this area continues to meet the PM10 NAAQS (see Appendix B for details of the local ordinances).
1. Solid fuel space heating devices shall be prohibited from burning plastics, petroleum by-products, petroleum treated materials, rubber products, animal remains, animal or vegetable matter resulting from the handling, preparation, cooking, or service of food, or of any other material which normally emits dense smoke or noxious odors.
2. During a Green or Yellow advisory the discharge of emissions from a solid fuel space heating device shall be limited to a maximum opacity of 40%. There will be a 10 minute exemption during every 4 hour period for the building of a new fire.
In addition, the State of Oregon has recently adopted the “Heat Smart” law. This law requires the removal and decommissioning of any uncertified woodstove or fireplace insert from a home when it is sold.
As depicted in the existing SIP for this area, and confirmed by October 3, 1994, correspondence from EPA Region 10 (see Appendix E), motor vehicles are not a significant contributor to PM10 emissions in this area and therefore regional PM10 conformity determinations are not required. Hot spot conformity analysis for projects meeting federal criteria will continue to be required. This current analysis reaffirms the status of motor vehicles as an insignificant contributor to PM10 emissions in this area.
Although industrial sources are not the significant contributor to PM10 exceedances, industrial emissions growth will be controlled through New Source Review regulations. The Lowest Achievable Emission Rate (LAER) requirement for non-attainment areas will be replaced by Best Available Control Technology (BACT) for maintenance areas. Offsets and net air quality benefit will also be required.
As described in Appendix D, the 24 hour PM 2.5 standard would be violated well before the PM10 standard was reached. A violation of the PM2.5 standard would trigger SIP action for that pollutant which would also provide additional controls for PM10 emissions. Although monitoring for PM2.5 would technically be adequate to demonstrate compliance with the PM10 NAAQS, as resources allow, LRAPA will continue to monitor for PM10.
Appendix A
Eugene-Springfield PM10 Non-Attainment Area Limited Maintenance Plan
Qualification Analysis
According to EPA guidance, to qualify for the LMP option an area should meet the following applicable criteria:
1. The area should attain the NAAQS.
2. The average 24 hour PM10 design value for the area based upon
recent 5 years of data should not exceed 98 ug/m3 and the annual design
value should not exceed 40 ug/m3.
3. The area should expect only limited growth in on-road motor vehicle PM10
emissions.
Attainment with NAAQS:
As demonstrated by the historical monitoring data and confirmed by a saturation monitoring study conducted by LRAPA in 1989, the Hwy 99 Site (# 410390058) measures the highest PM10 concentrations within the non-attainment area. Recent data from this site demonstrates that this area clearly attains the NAAQS of 150 ug/m3 for the 24 hour standard and the former 50 ug/m3 annual standard.
Eugene-Springfield UGB
PM 10 Concentrations (ug/m3)
Hwy 99 Site # 410390058
Annual Highest
Year 24 hour Concentration Annual Mean
(ug/m3) (ug/m3)
2000 73 19
2001 65 19
2002 66 19
2003 45 19
2004 59 17
2005 50 17
2006 68 19
2007 78 16
2008 56 17
24 Hour Design Value:
As recommended in EPA guidance, the Upper 10% Tail Exponential Distribution Method was used to calculate the 24 hour design value. Data from the Hwy 99 Site was used for the calculation. As depicted in the following, this area=s 24 hour design value is 66 ug/m3 which is well below the guidance level of 98 ug/m3.
Calculate the average of the rolling 3 year design values for the 5 year period using the Upper 10% Tail Exponential Distribution:
equation: DV = X90 + 3.61 (U90 - X90)
where: DV = design value
X90 = 90th percentile concentration
U90 = mean of the upper 10% of samples
For the period 2004 - 2006 there were 359 samples (no data was flagged):
X90 = 35 ug/m3
U90 = 42 ug/m3
DV = 35 ug/m3 + 3.61(42 ug/m3 - 35.0 ug/m3) = 60 ug/m3
For the period 2005 - 2007 there were 359 samples (no data was flagged):
X90 = 34 ug/m3
U90 = 43 ug/m3
DV = 34 ug/m3 + 3.61(43 ug/m3 - 34 ug/m3) = 66 ug/m3
For the period 2006 - 2008 there were 360 samples (no data was flagged):
X90 = 33 ug/m3
U90 = 44 ug/m3
DV = 33 ug/m3 + 3.61(44 ug/m3 - 33 ug/m3) = 73 ug/m3
Average 24 Hour Design Value:
(60 ug/m3 + 66 ug/m3 + 73 ug/m3)/3 = 66 ug/m3
Annual Design Value:
The annual design value is 17 ug/m3 which is well below the guidance level of 40 ug/m3.
Calculate the average of the rolling 3 year design value for the 5 year period using the annual means of the 4 quarters:
Year Quarterly Annual Mean (ug/m3)
2008 17
2007 16
2006 19
2005 17
2004 17
For the period 2004 - 2006:
Annual DV = (17 ug/m3 + 17 ug/m3 +19 ug/m3)/3 = 17.67 ug/m3
For the period 2005 - 2007:
Annual DV = (17 ug/m3 + 19 ug/m3 + 16 ug/m3)/3 = 17.33 ug/m3
For the period 2006 - 2008:
Annual DV = (19 ug/m3 + 16 ug/m3 + 17 ug/m3)/3 = 17.33 ug/m3
Average Annual DV = (17.67 ug/m3 + 17.33 ug/m3 + 17.33 ug/m3)/3 = 17 ug/m3
Motor Vehicle Regional Analysis:
Using the method recommended in EPA Guidance, an on-road motor vehicle regional analysis was performed. As depicted in the following, there will be only limited growth in on-road motor vehicle PM10 emissions.
EPA Guidance Equation:
DV + (VMTpi * DVmv) < MOS
where: DV = area design value
VMTpi = projected % increase in vmt 10 years from base year
(projected increase in VMT from 2008 - 2018 is 14.3% -
from local MPO transportation modeling estimate)
DVmv = motor vehicle design value based upon on-road portion
of base year EI
MOS = margin of safety for PM10 standard: 98 ug/m3 for 24 hour
standard and 40 ug/m3 for annual standard
24 hour analysis:
From 2008 attainment year winter day EI
total winter day emissions = 14.1 tons
total motor vehicle winter day emissions = 1.2 tons
% mv = 8.5
DV = 66 ug/m3
VMTpi = 0.143
DVmv = 5.61 ug/m3
66 ug/m3 + (0.143 * 5.61 ug/m3) = 67 ug/m3
annual analysis:
From 2008 base year EI
total annual emissions = 2,753.8 tons
total motor vehicle annual emissions = 401.5 tons
% mv = 14.58
DV = 17 ug/m3
VMTpi = 0.143
DVmv = 2.48 ug/m3
17 ug/m3 + (0.143 * 2.48 ug/m3) = 17 ug/m3
Appendix B
Local Home Wood Heating Ordinances
Eugene Code
6-16 12/28/2007
Solid Fuel Space Heating Devices
6.250 Solid Fuel Space Heating Devices - Definitions. As used in sections
6.255 to 6.265, the following words and phrases mean:
City manager. City manager or designee, including, if the city manager so
designates, LRAPA.
Green advisory. A 24-hour period beginning at 4:00 p.m. when PM10 levels
are forecast by LRAPA to be less than 100 micrograms per cubic meter and
PM2.5 levels are forecast to be less than 25 micrograms per cubic meter.
LRAPA. Lane Regional Air Pollution Authority, a regional air quality control
authority established under the provisions of, and with authority and powers
derived from, Oregon Revised Statutes 468.500 et seq.
Opacity. The degree to which an emission reduces transmission of light or
obscures the view of an object in the background.
Pellet stove. An enclosed solid fuel space heating device designed and
operated to burn manufactured solid fuel and having an air-to-fuel ratio
greater than 35-to-1 as determined by the federal test method described in
40 CFR Part 60.534.
Person. Any individual, partnership, corporation, association, governmental
subdivision or public or private organization of any character.
Person in charge of property. An agent, occupant, lessee, tenant, contract
purchaser, or other person having possession or control of property.
PM2.5. Solid or liquid particulate matter (excluding uncombined water) with
an aerodynamic diameter less than or equal to 2.5 micrometers.
PM10. Solid or liquid particulate matter (excluding uncombined water) with
an aerodynamic diameter less than or equal to 10 micrometers.
Eugene Code
6-17 12/28/2007
Sole source of heat. A solid fuel space heating device which constitutes the
only source of heating in a private residence. A solid fuel space heating
device shall not be considered to be the sole source of heat if the private
residence is equipped with any permanently installed furnace or heating
system utilizing oil, natural gas, electricity or propane.
Solid fuel space heating device. Any device designed or operated to burn
solid fuel for the heating of the interior of a building, including, but not limited
to, solid fuel burning stoves, fireplaces or wood stoves of any nature,
combination fuel furnaces or boilers used for space heating which can burn
solid fuel, and solid fuel burning cooking stoves. "Solid fuel space heating
device" does not include natural gas fired artificial fireplaces.
Stage I red advisory. A 24-hour period beginning at 4:00 p.m. when PM10
levels are forecast by LRAPA to be greater than or equal to 125 micrograms
per cubic meter but less than 150 micrograms per cubic meter, or when
PM2.5 levels are forecast by LRAPA to be greater than or equal to 30
micrograms per cubic meter but less than 35 micrograms per cubic meter,
within the Eugene-Springfield Metropolitan Area General Plan Urban Growth
Boundary.
Stage II red advisory. A 24-hour period beginning at 4:00 p.m. when PM10
levels are forecast by LRAPA to be greater than or equal to 150 micrograms
per cubic meter, or when PM2.5 levels are forecast by LRAPA to be greater
than or equal to 35 micrograms per cubic meter, within the Eugene-
Springfield Metropolitan Area General Plan Urban Growth Boundary.
Visible emissions. The reduction in transmission of light or the obscuring of
the view of an object in the background caused by the air pollutants emitted
by the heating device. This does not include the visual distortion caused by
the heated air emitted by the heating device.
Yellow advisory. A 24-hour period beginning at 4:00 p.m. when PM10
levels are forecast by LRAPA to be greater than or equal to 100 micrograms
per cubic meter but less than 125 micrograms per cubic meter, or when
PM2.5 levels are forecast to be greater than or equal to 25 micrograms per
cubic meter but less than 30 micrograms per cubic meter.
(Section 6.250 added by Ordinance No. 19731, enacted November 5, 1990, effective January
1, 1991; amended by Ordinance No. 19815, enacted December 2, 1991; Ordinance No. 20261,
enacted July 22, 2002, effective August 22, 2002; and Ordinance No. 20399, enacted
November 26, 2007, effective December 28, 2007.)
6.255 Solid Fuel Space Heating Devices - Prohibitions.
(1) No person in charge of property during a Stage I Red Advisory shall
operate or allow to be operated a solid fuel space heating device which
emits visible emissions into the air outside of the building housing the
Eugene Code
6-18 12/28/2007
device, unless the person has been granted an exemption to use the
device by the city manager.
(2) No person in charge of property during a Stage II Red Advisory shall
operate or allow to be operated a solid fuel space heating device
unless:
(a) The person has been granted an exemption to use the device by
the city manager; or
(b) The person is operating a pellet stove which emits no visible
emissions into the air outside of the building housing the device.
(3) No person in charge of property shall at any time allow to be initiated or
maintained in a solid-fuel space-heating device the burning of any
plastics, wire insulation, petroleum by-products (with the exception of
natural-gas-fueled log lighters), petroleum-treated materials, rubber
products, animal remains, or animal or vegetable matter resulting from
the handling, preparation, cooking, or service of food, or of any other
material which normally emits dense smoke, noxious odors, or
hazardous air contaminants.
(4) During a green or yellow advisory, no person in charge of property shall
operate or allow to be operated a solid-fuel space-heating device which
discharges emissions that are of an opacity greater than 40 percent.
This provision does not apply to the emissions during the building of a
new fire, for a period or periods aggregating no more than ten minutes
in any four-hour period.
(Section 6.255 added by Ordinance No. 19731, enacted November 5, 1990, effective January 1,
1991; amended by Ordinance No. 19815, enacted December 2, 1991; and Ordinance No.
20261, enacted July 22, 2002, effective August 22, 2002.)
6.260 Solid Fuel Space Heating Devices - Exemptions. Notwithstanding section
6.255 of this code, a person in charge of property may operate a solid fuel
space heating device during a Stage I or Stage II Red Advisory if that person
has previously obtained one of the following exemptions from the city
manager:
(a) Sole source of heat exemption. A person in charge of property who
signs a sworn statement that their solid fuel space heating device is the
sole source of heat for their residence. This exemption shall expire on
July 1 of each year and must be renewed annually. This exemption
shall not be issued after June 30, 1996.
(b) Economic need exemption. Persons in charge of property who satisfy
criteria established under the Low Income Energy Assistance Program
as administered by the Lane County Housing Authority and as
established by the United States Department of Energy. This
exemption shall expire on July 1 of each year and must be renewed
annually thereafter.
(Section 6.260 added by Ordinance No. 19731, enacted November 5, 1990, effective January 1,
1991.)
Eugene Code
6-19 12/28/2007
6.265 Solid Fuel Space Heating Devices - Enforcement. In addition to, and not
in lieu of any other enforcement mechanism authorized by this code, upon a
determination that a person has violated section 6.255 of this code, the city
manager may impose upon the violator and any other person in charge of the
property, an administrative penalty not greater than $500, as provided by
section 2.018 of this code. The city manager also is authorized to designate
LRAPA to enforce and administer the provisions of sections 2.655 to 2.670 of
this code, including LRAPA's use of administrative and hearing procedures
adopted by LRAPA in its duly promulgated regulations.
(Section 6.265 added by Ordinance No. 19731, enacted November 5, 1990, effective January 1,
1991.)
Lane Code
RESTRICTION ON USE OF SOLID FUEL SPACE HEATING DEVICES
9.120 Purpose and Findings.
9.125 Definitions.
9.130 Area of Applicability.
9.135 Prohibitions.
9.140 Exemption for Economic Need.
9.145 Enforcement.
9.150 Penalties.
RESTRICTION ON USE OF SOLID FUEL SPACE HEATING DEVICES
9.120 Purpose and Findings.
(1) The health, safety and welfare of the citizens of Lane County are adversely
affected by the degradation of air quality. Violations of federal ambient air quality
standards, as measured by the Lane Regional Air Pollution Authority (LRAPA), occur
periodically in Lane County.
(2) Wood and other solid fuel combustion for space heating produces
particulate matter and other emissions which are physically harmful and aesthetically
unpleasant, and which contribute to the degradation of air quality and the violation of
federal ambient air quality standards.
(3) Periodic restriction of the use of solid fuel space heating devices will
improve air quality. LRAPA has the expertise to determine when such air quality is at
such a level that such restriction is necessary to preserve the health, safety and welfare of
the citizens of Lane County.
(4) It is the intent of Lane County that the penalty section of this ordinance not
take effect until November 1, 1991. (Revised by Ordinance No. 9-90, Effective 1.18.91)
9.125 Definitions.
As used herein, the following words and phrases shall mean:
Green Advisory. A 24-hour period beginning at 4:00 p.m. when PM10 levels are
forecast by LRAPA to be less than 100 micrograms per cubic meter and PM2.5 levels are
forecast to be less than 41 micrograms per cubic meter, within the Eugene/Springfield
Metropolitan Area General Plan Urban Growth Boundary.
Lane Regional Air Pollution Authority. A regional air quality control authority
established under the provisions of and with the authority and powers derived from ORS
468.500 et seq.
Opacity. The degree to which an emission reduces transmission of light or
obscures the view of an object in the background.
Pellet Stove. An enclosed solid fuel space heating device designed and operated
to burn manufactured solid fuel and having an air-to-fuel ratio greater than 35-to-1 as
determined by the federal test method described in 40 CFR Part 60.534
Person. Any individual, partnership, corporation, association, governmental
subdivision or public or private organization of any character.
Person in Charge of Property. An agent, occupant, lessee, tenant, contract
purchaser, or other person having possession or control of property.
PM2.5. Solid or liquid particulate matter (excluding uncombined water) with an
aerodynamic diameter less than or equal to 2.5 micrometers.
PM10. Solid or liquid particulate matter (excluding uncombined water) with an
aerodynamic diameter less than or equal to 10 micrometers.
Sole Source of Heat. A solid fuel space heating device which constitutes the
only source of heating in a private residence. A solid fuel space heating device shall not
be considered to be the sole source of heat if the private residence is equipped with any
permanently-installed furnace or heating system utilizing oil, natural gas, electricity or
propane.
Solid Fuel Space Heating Device. Any device designed or operated to burn solid
fuel for the heating of the interior of a building, including, but not limited to, solid fuel
burning stoves, fireplaces or wood stoves of any nature, combination fuel furnaces or
boilers used for space heating which can burn solid fuel, and solid fuel burning cooking
stoves. "Solid fuel space heating device" does not include natural gas-fired artificial
fireplaces.
Stage I Red Advisory. A 24-hour period beginning at 4:00 p.m. when PM10
levels are forecast by LRAPA to be greater than or equal to 125 micrograms per cubic
9.130 Lane Code 9.140
9-10 LC9
meter but less than 150 micrograms per cubic meter, or when PM2.5 levels are forecast
by LRAPA to be greater than or equal to 55 micrograms per cubic meter but less than 65
micrograms per cubic meter, within the Eugene/Springfield Metropolitan Area General
Plan Urban Growth Boundary.
Stage II Red Advisory. A 24-hour period beginning at 4:00 p.m. when PM10
levels are forecast by LRAPA to be greater than or equal to 150 micrograms per cubic
meter, or when PM2.5 levels are forecast by LRAPA to be greater than or equal to 65
micrograms per cubic meter, within the Eugene/Springfield Metropolitan Area General
Plan Urban Growth Boundary.
Visible Emissions. The reduction in transmission light or the obscuring of the
view of an object in the background caused by the air pollutants emitted by the heating
device. This does not include the visual distortion caused by the heated air emitted by the
heating device.
Yellow Advisory. A 24-hour period beginning at 4:00 p.m. when PM10 levels
are forecast by LRAPA to be greater than or equal to 100 micrograms per cubic meter but
less than 125 micrograms per cubic meter, or when PM2.5 levels are forecast to be
greater than or equal to 41 micrograms per cubic meter but less than 55 micrograms per
cubic meter, within the Eugene/Springfield Metropolitan Area General Plan Urban
Growth Boundary. (Revised by Ordinance No. 9-90, Effective 1.18.91; 1-00, 4.12.00; 13-03, 10.23.03)
9.130 Area of Applicability.
The Metropolitan Area General Plan Urban Growth Boundary adopted in 1982 as
amended through June 2003, excluding the area within the city limits of Eugene and
Springfield. (Revised by Ordinance No. 9-90, Effective 1.18.91; 13-03, 10.23.03)
9.135 Prohibitions.
(1) Stage I Red Advisory. No person in charge of property during a Stage I
Red Advisory shall operate or allow to be operated a solid fuel space heating device
which emits visible emissions into the air outside of the building housing the device
unless the person in charge of the property has been granted an exemption to use the
device by LRAPA.
(2) Stage II Red Advisory. No person in charge of property during a Stage II
Red Advisory shall operate or allow to be operated a solid fuel space heating device
unless the person in charge of the property has been granted an exemption to use the
device by LRAPA or unless the person is operating a pellet stove which emits no visible
emissions into the air outside of the building housing the device.
(3) Green or Yellow Advisory. No person in charge of property during a
green or yellow advisory shall operate or allow to be operated a solid fuel space heating
device which discharges emissions that are of an opacity greater than forty (40) percent.
This provision does not apply to the emissions during the building of a new fire, for a
period or periods aggregating no more than ten (10) minutes in any four (4) hour period.
(4) Prohibited Materials. No person in charge of property shall at any time
allow to be initiated or maintained in a solid fuel space heating device the burning of any
plastics, wire insulation, petroleum by-products (with the exception of natural-gas-fueled
log lighters), petroleum treated materials, rubber products, animal remains, or animal or
vegetable matter resulting from the handling, preparation, cooking, or service of food, or
of any other material which normally emits dense smoke, noxious odors, or hazardous air
contaminants. (Revised by Ordinance No. 9-90, Effective 1.18.91; 1-00, 4.12.00; 13-03, 10.23.03)
9.140 Exemption for Economic Need.
Exemption from LC 9.135 above for Stage II and/or Stage I Red Advisories may be
obtained from LRAPA for economic need. Persons in charge of property who satisfy
criteria established under the Low Income Energy Assistance Program as administered by
9.145 Lane Code 9.215
9-11 LC9
the Lane County Housing Authority and as established by the United States Department
of Energy are exempt from LC 9.135 above for both Stage I and Stage II Red Advisories.
Individual exemptions shall expire on July 1 of each year and must be renewed annually.
(Revised by Ordinance No. 9-90, Effective 1.18.91; 1-00, 4.12.00)
9.145 Enforcement.
The Board of County Commissioners designates LRAPA to enforce the prohibitions
contained herein. The investigation, initiations of proceedings, adjudication of a failure
to comply and appeal of such shall be regulated by the adopted administrative and
hearing procedures of LRAPA set forth in its Rules and Regulations.
The County shall also retain the right to investigate and enforce the terms of this
ordinance. Existing citation, complaint, violation, or failure to comply procedures applicable
to the County may be utilized to prosecute such failures to comply. (Revised by
Ordinance No. 9-90, Effective 1.18.91; 1-00, 4.12.00)
9.150 Penalties.
Failure to comply with LC 9.135 above shall be subject to administrative enforcement
pursuant to LC Chapter 5, including a monetary penalty of a minimum of $50 to a
maximum of $500 for each day in which such failure to comply occurs. This remedy is
cumulative and is in addition to any and all other remedies available to Lane County.
(Revised by Ordinance No. 9-90, Effective 1.18.91; 1-00, 4.12.00)
Springfield Code
AIR POLLUTION
4.500 Lane Regional Air Protection Agency.
The Lane Regional Air Protection Agency (LRAPA) is the primary authority responsible for the control and/or abatement of air pollution in the city. As part of its duties LRAPA is responsible under its rules and regulations and Oregon Administrative Rules, for administering the most current Oregon Revised Statutes which concern air quality. [Section 4.500 amended by Ordinance No. 6216, enacted February 22, 2008.]
4.502 City Responsibilities.
On any matters pertaining to air quality that are not administered by LRAPA, the city will comply with the most current Oregon Revised Statutes which concern air quality and the adopted state implementation plan for the Eugene-Springfield Area.
4.504 Abatement.
Nothing in sections 4.500 to4.512 shall restrict the right of the city to abate a nuisance in any matter otherwise.
Solid Fuel Space Heating Devices.
4.508 Prohibitions.
(1) Stage I Red Advisory. No person in charge of property during a Stage I Red Advisory shall operate or allow to be operated a solid fuel space heating device which emits visible emissions into the air outside of the building housing the device unless the person in charge of the property has been granted an exemption to use the device by LRAPA.
(2) Stage II Red Advisory. No person in charge of property during a Stage II Red Advisory shall operate or allow to be operated a solid fuel space heating device unless the person in charge of the property has been granted an exemption to use the device by LRAPA or unless the person is operating a pellet stove which emits no visible emissions into the air outside of the building housing the device.
(3) No person in charge of property shall at any time allow to be initiated or maintained in a solid-fuel space-heating device the burning of any plastics, wire insulation, petroleum by-products, petroleum-treated materials, rubber products, animal remains, or animal or vegetable matter resulting from the handling, preparation, cooking or service of food, or of any other material which normally emits dense smoke, noxious odors, or hazardous air contaminants. This section does not prohibit use of natural gas fuels to light solid fuels.
(4) During a green or yellow advisory, no person in charge of property shall operate or allow to be operated a solid-fuel space-heating device which discharges emissions that are of an opacity greater than 40 percent. This provision does not apply to the emissions during the building of a new fire, for a period or periods aggregating no more than 10 minutes in any four-hour period. [Section 4.508 amended by Ordinance No. 6026, enacted December 2, 2002.]
4.510 Exemptions.
A person in charge of property may operate a solid fuel space heating device during a Stage I or Stage II Red Advisory if that person has previously obtained one of the following exemptions from LRAPA.
(1) Sole Source of Heat: A person in charge of property who signs a sworn statement that the solid fuel space heating device is the sole source of heat for that persons residence is exempt from section 2 above. Individual exemptions shall expire on July 1 of each year and must be renewed annually. This exemption shall not be issued by LRAPA after June 30, 1996.
(2) Economic Need: Persons in charge of property who satisfy criteria established under
the Low Income Energy Assistance Program as administered by the Springfield Utility Board and as established by the United States Department of Energy are exempt from the prohibitions established herein. Individual exemptions shall expire on July 1 of each year and must be renewed annually.
4.512 Enforcement.
(1) LRAPA is hereby authorized and designated to enforce and administer the process of sections 4.508 through 4.512 of the code in accordance with the adopted administrative and hearing procedures of LRAPA set forth in its rules and regulations adopted November 10, 1992.
(2) Violations. Penalties shall be in accordance with applicable state laws and LRAPA “Rules of Practice and Procedures” adopted February 13, 1990.
Appendix C
2008 Attainment Year Emission Inventory for the Eugene-Springfield UGB
An annual and a Winter day emission inventory have been developed for the Eugene-Springfield UGB. The methodology used for developing the emission inventory for each source category is discussed. In each case, EPA approved methods were used.
The results of this analysis are summarized in Table C1. As the data depicts, residential wood combustion is the primary contributor of PM10 to the airshed on Winter days when historically this area has exceeded the 24 hour standard.
Table C1
2008 estimated PM10 emissions for the Eugene/Springfield UGB
Source Annual (tons/year) Winter Day (tons/day)
Point Sources 1,624.1 4.4
Residential wood combustion 728.2 8.5
Road Dust 281.2 0.8
Motor vehicle exhaust, 120.3 0.4
brake and tire wear
Total 2,753.8 14.1
Point Sources:
Although the EPA definition of a point source for PM10 in moderate non-attainment areas is one having emissions > 100 tons/year, for the purposes of this emissions inventory sources > 10 tons/year will be included. This more complete listing of sources creates a more accurate estimate of the impact of point sources in this area. Within the UGB there are 10 sources which have Federal Title V Operating Permits, 3 sources with Synthetic Minor Operating Permits, and 9 sources with LRAPA Air Contaminant Discharge Permits (ACDP), which have annual PM10 emissions > 10 tons/year. The permitted Plant Site Emission Limits were used to estimate emissions for 2008, since actual emissions are not available. All of these sources operate with a fairly consistent production rate year-round. The estimate of daily emissions is a direct fraction of the annual emissions.
Title V Sources:
Permit # Name Annual PM10 (t/y)
203129 G.P. Resins 12.4
203102 Murphy 64.0
204402 Kingsford mfg. 194.0
207510 Mckenzie Forrest Products 219.8
207050 Rosboro 213.0
208866 Sierra Pine 214.9
208256 Trus Joist Eugene 61.4
208850 International Paper 305.0
200529 Flakeboard America MDF 70.0
208864 Pacific States Plywood 34.0
Synthetic Minor Sources
Permit # Name Annual PM10 (t/y)
202805 Forrest Paint 17.0
208557 University of Oregon Boiler 24.6
208894 Whittier Wood Products 23.7
ACDP Sources
Permit # Name Annual PM10 (t/y)
201270 Cafeto Custom Roasting 14.0
206122 Caffe Pacori 14.0
202528 Emerald Forest Products #1 49.0
203103 Georgia Pacific Irving 15.7
208250 Mckenzie Forest Products 10.6
202108 Northwest Hardwoods 11.0
207488 Ridgeline 15.0
207075 Rexius Forest Byproducts 14.0
207459 Seneca Sawmill 27.0
Total Point Source Annual Emissions = 1,624.1 tons/year
Point Source Daily Emission Estimate = 4.4 tons/day
Area Sources:
Residential Wood Combustion:
Emissions were developed from the estimated use of wood stoves, pellet stoves, and fireplaces within the UGB. Estimates of usage were made using the results of the most recent survey; a 2009 study performed by Advanced Marketing Research Inc. (see Appendix F). The emission factors used were from EPA AP42 tables 1.9-1 and 1.10-1. The daily usage was estimated using Heating Degree Days for the worst case winter day in 2008.
2008 Residential Wood Combustion PM10 Emissions Estimates
Eugene-Springfield UGB
Wood Burning Device |
# of households using device1 |
2008 total fuel burned2 (tons) |
PM10 emission factor3 (lbs/ton) |
2008 Emission4 (tons) |
fireplace |
18,233 |
19,327 |
34.6 |
334.4 |
C woodstove and fireplace insert uncertified |
8,104 |
15,641 |
30.6 |
239.3 |
P phase II certified catalytic Wood stove and insert |
8,104 |
15,641 |
16.2 |
126.7 |
P Pellet stove
|
7,091 |
6,311 |
8.8 |
27.8 |
Total Annual PM10 Emissions from RWC = 728.2 tons
The Worst Case Winter Day PM10 Emissions from RWC = 8.5 tons5
1. Household Calculations:
The Lane Council of Governments (the local Metropolitan Planning Organization) estimates a total of 101,296 households within the Eugene-Springfield UGB during 2008.
The 2009 survey provides estimates of the percentage of households using a particular type of wood burning device as follows:
fireplace w/o insert and other misc. devices = 18%
conventional woodstoves and fireplace inserts = 8%
phase II certified woodstoves = 8%
pellet stoves = 7%
(total households) (fraction using device) = number of households using
device
2. Total Fuel Burned Calculations:
Based upon discussions with local firewood retailers and with federal
agencies that provide firewood cutting permits, the primary species used for
firewood in this area is Douglas Fir.
the density of Douglas Fir is 32 lbs/ft3 (EPA AP42 Appendix A)
the volume of a cord of wood is approximately 80 ft3 (EPAvol III chapter 2
EIIP RWC Jan 2001)
therefore, one cord of Douglas Fir weighs 1.28 tons
Based upon previous local surveys, the heating season for the
Eugene/Springfield UGB is defined as October through March.
The most recent formal survey was conducted in 2009 with fuel usage estimates for 2008.
The 2009 survey provides estimates of the amount of wood burned by each
type of wood burning device as follows:
fireplace w/o insert - an average of 0.83 cords per device per year (0.83 cords) (1.28 tons/cord) = 1.06 tons per device per
year
conventional woodstoves and fireplace inserts - an average of 1.51 cords
per device per year (1.51 cords) (1.28 tons/cord) = 1.93 tons per device
per year
phase II certified woodstoves - an average of 1.51 cords per device per year
(1.51 cords)(1.28 tons/cord) = 1.93 tons per device per year
pellet stoves - burned an average of 0.89 tons of pellets per year
3. PM10 emission factors:
EPA AP 42 tables 1.9-1 and 1.10-1
4. 2008 emissions calculation:
(2008 total fuel burned (tons)) (PM10 emission factor (lbs/ton)) (1/2000
lbs/ton) = 2008 PM10 emissions (tons)
5. Worst Case Day Emissions:
For the worst case day emissions estimate, it was assumed that the amount
of wood burned is directly proportional to the Heating Degree Days (HDD). As defined by the National Weather Service, a HDD is calculated by averaging the daily maximum and minimum temperatures and for each degree that number is below 65 degrees, it is one degree day. Therefore, if the maximum and minimum temperatures average to 63 degrees, that is 2 degree days.
The peak HDD date in 2008 was 12/16/08 with 46 HDD. To compute the
daily emissions estimate multiply the ratio of the peak day HDD to the total season HDD with the season total emission estimate. The season total HDD
for 2008 was 3,927.
(46/3,927) (728.2 tons) = 8.5 tons
On Road Mobile Sources:
Road Dust:
Emissions estimates for Road Dust were developed using EPA AP42 emission factors and VMT estimates from the Lane Council of Governments (the local MPO) as follows:
equation 1 in AP42 section 13.2.1
E = k(sL/2)0.65 * (W/3)1.5 - C
where:
E = PM10 emission factor (lbs/VMT)
k = particle size multiplier = 0.016 lbs/VMT (AP42 table 13.2-1.1)
sL = silt loading using AP42 table 13.2.1-3
5,000 - 10,000 ADT = 0.06 g/m2
> 10,000 ADT = 0.03 g/m2
from LCOG (personal communication) 76% of VMT in the
UGB is on roads > 10,000 ADT
sL = (0.76)(0.03) + (0.24)(0.06) = 0.037 g/m2
W = average weight of vehicles = 2.5 tons (ODOT personal
communication)
C = emission factor for fleet exhaust, brake wear, and tire wear
= 0.00047 lbs/VMT (AP42 table 13.2.1-2)
E = 0.000439 lbs/VMT
Annual Adjustment:
equation 2 in AP42 section 13.2.1
Eann = E (1 - P/4N)
where:
P = number of wet days in 2008 = 143
N = number of days in the year = 366
Eann = 0.000396 lbs/VMT
VMT estimates:
LCOG (personal communication) provided VMT estimates
average weekday VMT = 4.19 x 10⁶
annual VMT = 1.42 x 10⁹
Annual emission estimate = 281.2 tons/year
Daily emission estimate = 0.83 tons/day
Motor Vehicle Exhaust, Brake Wear, and Tire Wear:
The emissions were estimated using emission factors from EPA Mobile 6.2.
The VMT estimates were from the Lane Council of Governments (the local MPO).
Winter PM10 emission factor for exhaust, brake, and tire wear = 0.078 g/mi
Summer PM10 emission factor for exhaust, brake and tire wear = 0.0757g/mi
Composite annual emission factor = 0.0769 g/mi
Average weekday VMT = 4.19 x 10⁶
Annual VMT = 1.42 x 10⁹
Annual PM10 Emission Estimate = 120.3 tons/year
Winter Day PM10 Emission Estimate = 0.4 tons/day
Appendix D
PM10 / PM2.5 Relationship
In order to describe the relationship between PM10 and PM2.5 in the Eugene/Springfield area, a brief analysis is summarized here. It is LRAPA’s assertion that PM10 monitoring is unnecessary in this air shed because the ratio of PM2.5 to PM10 is high enough to ensure that the 24-hr PM2.5 standard would be violated before the PM10 standard was reached.
There are two existing PM10 monitoring sites in this area that were established in 1985, AQS number 410390013 (LCC) and AQS number 410390058 (Hwy 99). The Hwy 99 site has also monitored PM2.5 since 2007. A third site, AQS number 410390060 (AMZ), has previously monitored PM10 and currently monitors PM10 as a toxic metals method, funded through a temporary HAP project.
The most important fact regarding PM levels in Eugene/Springfield is that neither PM10 nor PM10c (coarse) are pollutants of concern here. There has not been an exceedance of the 24-hr PM10 standard since 1987. The 2007-2009 design values are 60 µg/m³ and 50 µg/m³ for Hwy 99 and LCC, respectively. Figure 1 shows that the Hwy 99 site is clearly the higher of the two sites. During the 2007-2009 period, the highest 24-hr PM10c value measured was 42 µg/m³. This is 57% of the 2006 proposed standard of 70 µg/m³.
Figure 1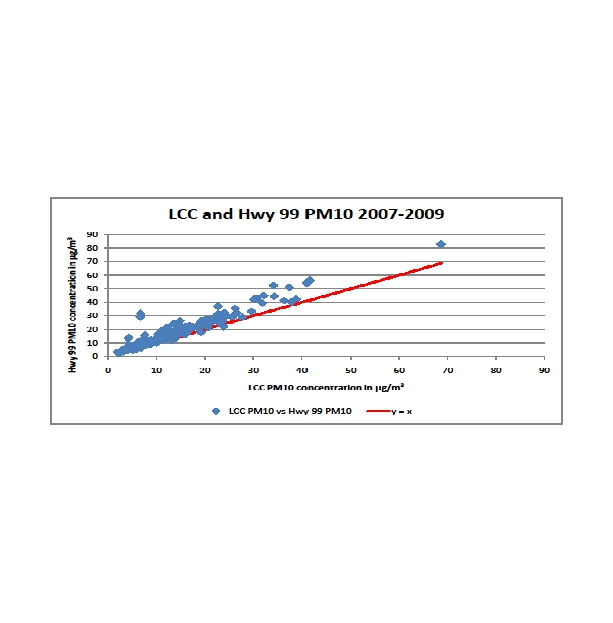
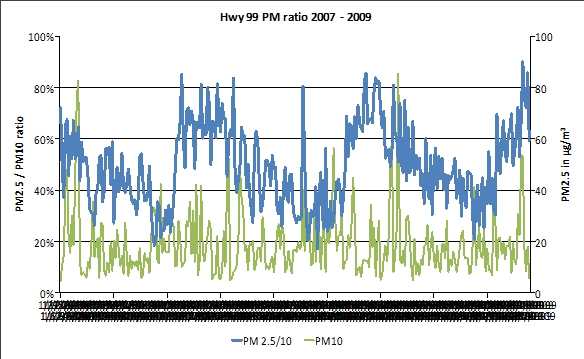
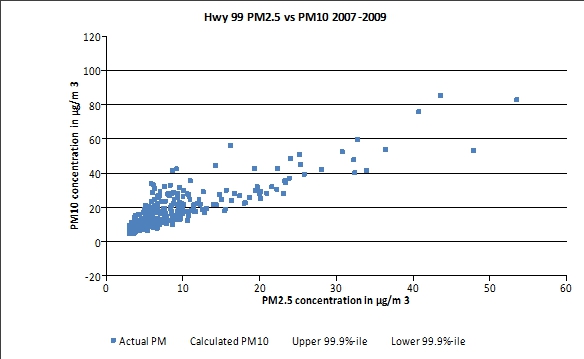
The collocated PM10 and PM2.5 data for 2007-2009 from Hwy 99 was used to examine the PM2.5/PM10 ratio. Figure 2 shows that as the PM2.5 concentration approaches 25 µg/m³, the ratio is equal to or greater than 50%. It follows that at or above 25 µg/m³ of PM2.5, the PM10 concentrations would be equal to, or less than, twice the PM2.5 concentration. Figure 3 displays another way to view the PM ratio. The coarse fraction only rises (that is, the ratio decreases) as the PM10 concentration reduces to insignificant values.
Figure 2
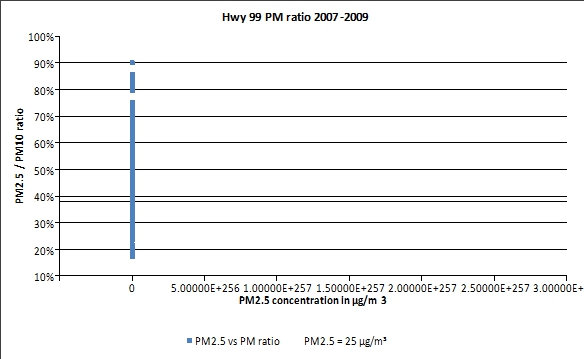
Figure 3
Finally, results of a regression analysis lead to the same conclusion. A simple linear regression was performed on 291 pairs of collocated observations ( >= 3 µg/m³) of PM.2.5 and PM10. This regression line predicts a PM10 concentration (PM10 = 1.397 * PM2.5 + 6.005) from an observed PM2.5 concentration with a good deal of certatinty (r2 = 0.708). Using a conservative limit of 99.9%, upper and lower confidence intervals are +/- 21 µg/m³. Figure 4 shows that at the point of a 24-hr PM2.5 exceedance, PM10 levels remain at 50% of the 24 hr PM10 standard.
Figure 4
Appendix E
EPA determination of Transportation Conformity for PM10
Appendix F
FUEL USE SURVEY
CONDUCTED FOR
LANE REGIONAL AIR PROTECTION AGENCY
October, 2009

P.O. Box 5244 · Eugene, OR 97405 · Phone/Fax 541-345-6600 · www.advancedmarketingresearch.com
TABLE OF CONTENTS
EXECUTIVE SUMMARY …………………………………………. 3
Purpose of the Study …………………………………………………. 5
Methodology …………………………………………………………. 5
Quotas Observed …………………………………………………. 5
Response Rate …………………………………………………. 6
Tests for Differences Between Proportions …………………………. 6
Notes on Chi Square …………………………………………………. 6
Demographic Characteristics of the Sample …………………………. 7
Bound on Error …………………………………………………. 8
Differences Between Percentage Points …………………………. 9
ANALYSIS OF DATA …………………………………………. 10
Primary Heat Source …………………………………………………. 11
Secondary Heat Sources …………………………………………. 12
Changes in Primary Heat Source …………………………………. 13
Current Use of Wood Stoves …………………………………………. 14
Current Use of Pellet Stoves …………………………………………. 15
Current Use of Wood-Burning Fireplaces …………………………. 16
Awareness of LRAPA …………………………………………………. 17
DATA TABLES …………………………………………………. 18
QUESTIONNAIRE INSTRUMENT
EXECUTIVE SUMMARY
Primary Heat Source (Q3-4)
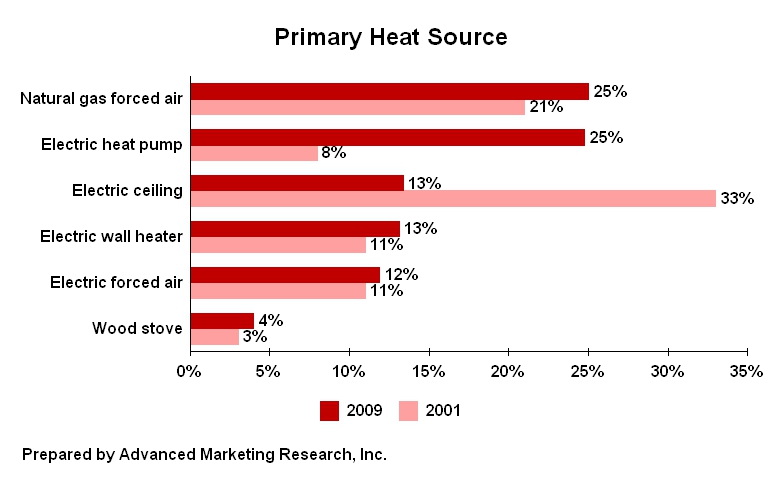
Natural gas forced air heaters and electric heat pumps top the list as primary sources of heat for Eugene/Springfield area residents, with 25% each. Electric ceiling heat and electric wall heaters are each the primary source of heat for 13%, and electric forced air is the source of heat for 12%.
The electric heat pump has moved up from 8% in 2001 to 25% currently, while electric ceiling heat has gone from 33% and first place in 2001, down to 13% currently.
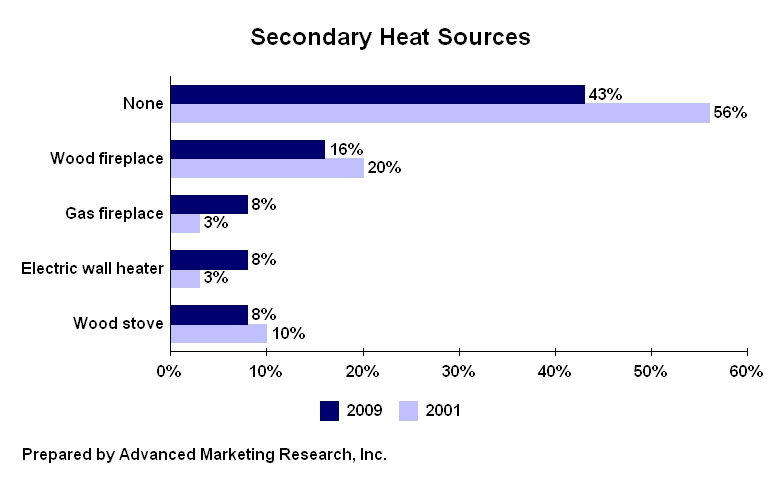
Secondary Heat Sources (Q5-6)
43% of residents do not have a secondary source of heat, down from 56% in 2001. 16% use a wood fireplace as a secondary source of heat, 8% use a gas fireplace, 8% use electric wall heaters, and 8% use wood stoves.
Changes in Primary Heat Source (Q7-10)
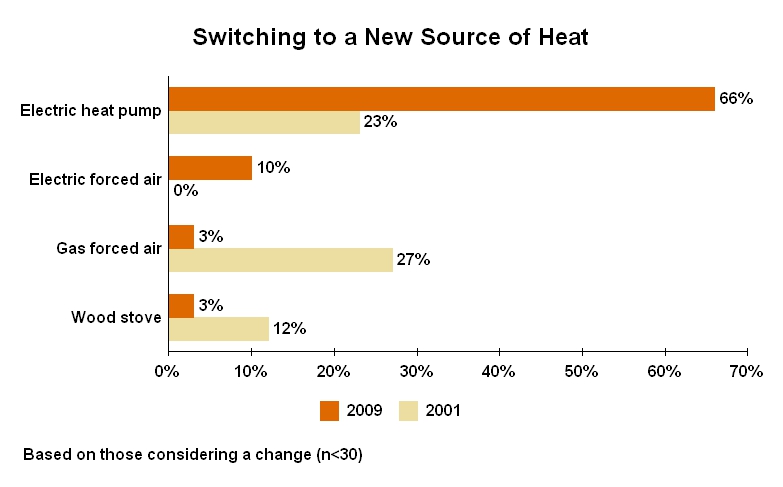
7% are considering a change in their primary heat source, consistent with 6% in 2001. Of those considering a change (n=29), 66% are planning to switch to an electric heat pump (up from 23% in 2001), 10% are planning to get electric forced air, and 3% are planning to get gas forced air (down from 27% in 2001).
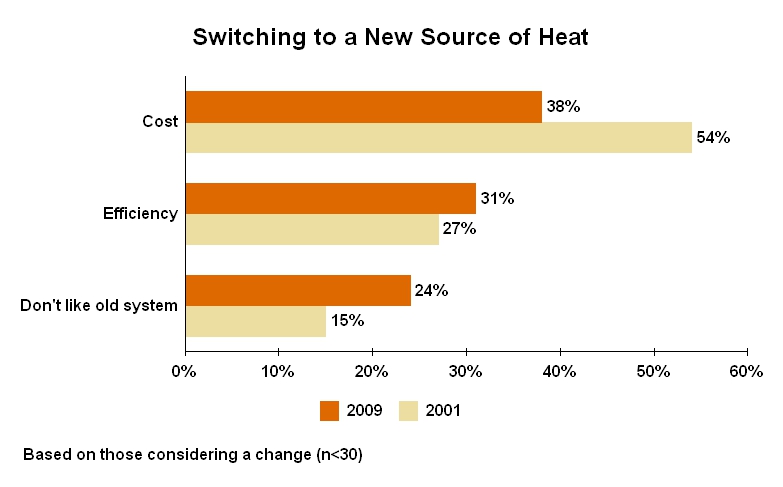
For those considering a switch (n=29), cost is the reason for 38%, efficiency is the reason for 31%, and 24% don’t like their current system. (See Table 10V for verbatim responses.)
Current Use of Wood Stoves (Q11-13)
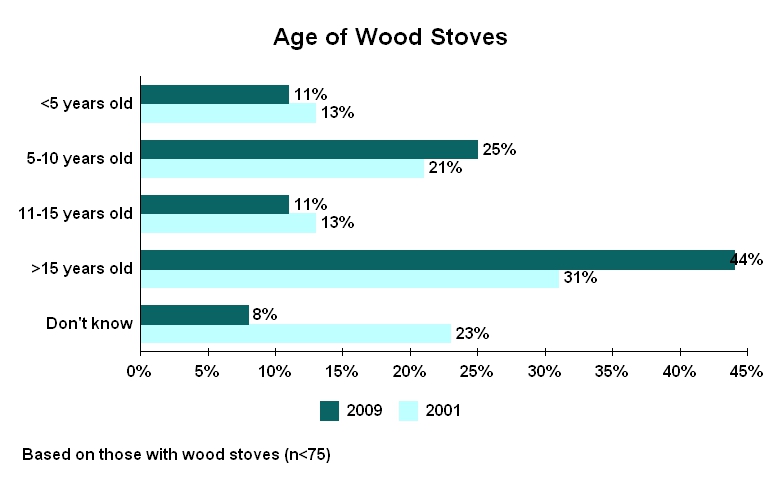
18% of residents currently have a wood stove, consistent with 15% in 2001. 44% of the wood stoves are over fifteen years old. 11% are eleven to fifteen years old, 25% are five to ten years old, and 11% are less than five years old. 8% of the wood stoves are of unknown age.
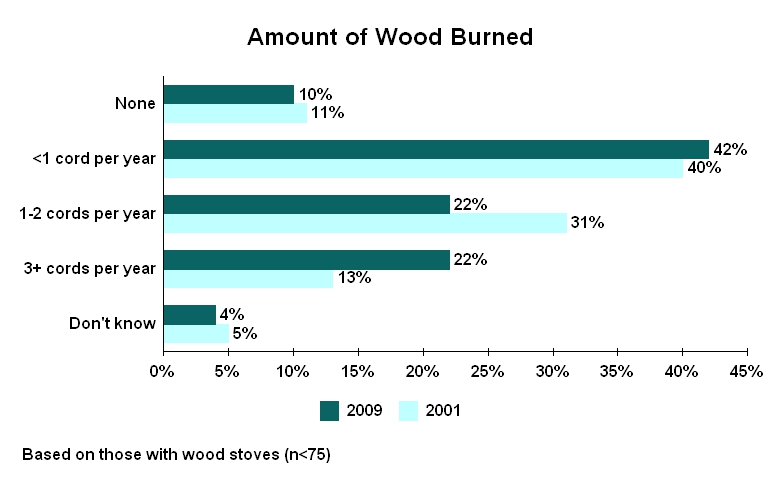
Of those with wood stoves (n=72), 10% do not use them at all. 42% burn less than one cord per year, 22% burn one to two cords per year, and 22% burn three or more cords each year. 4% are unsure how much wood they burn.
Current Use of Pellet Stoves (Q14-16)
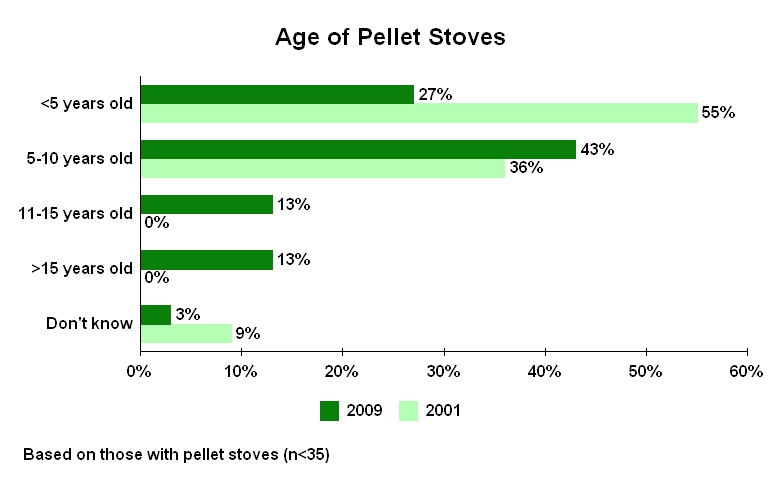
7% of residents currently have a pellet stove, consistent with 3% in 2001. 27% of the pellet stoves are under five years old, down from 55% in 2001. 43% are five to ten years old, 13% are eleven to fifteen years old, and 13% are over fifteen years old. 3% of the pellet stoves are of unknown age.
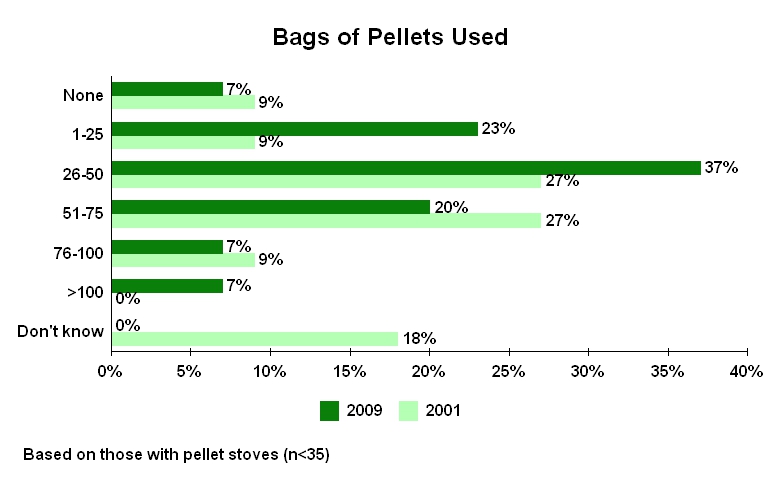
Of those with pellet stoves (n=30), 7% do not use them at all. 23% burn 1 to 25 bags of pellets per year. 37% burn 26 to 50 bags per year. 20% burn 51 to 75 bags per year. 14% burn over 75 bags each year.
Current Use of Wood-Burning Fireplaces (Q17-18)
31% of residents currently have a wood-burning fireplace, consistent with 37% in 2001.
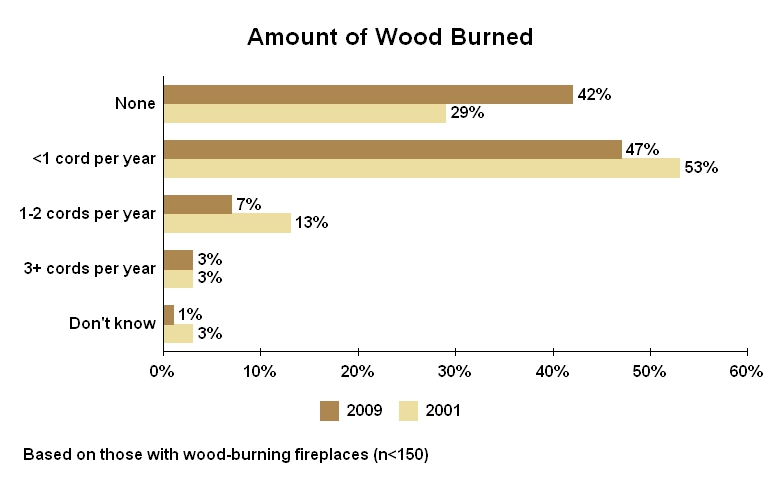
Of those with wood-burning fireplaces (n=125), 42% do not use them at all, up from 29% in 2001. 47% burn less than one cord per year, 7% burn one to two cords per year, and 3% burn three or more cords each year. 1% are unsure how much wood they burn.
Awareness of LRAPA (Q19)
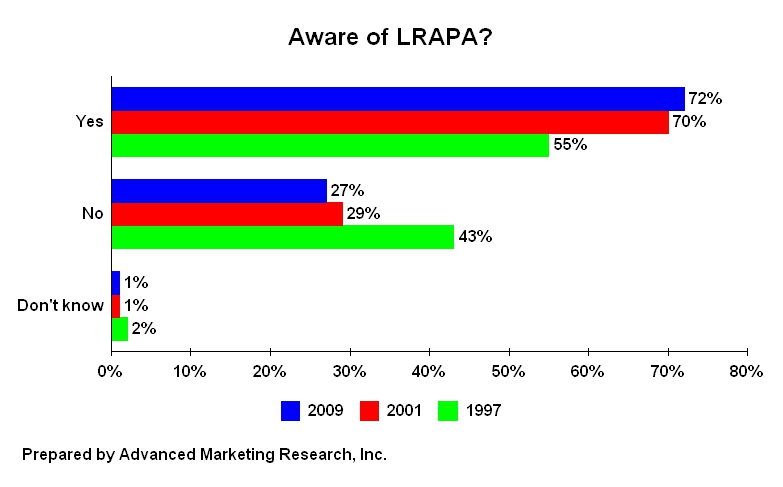
70% have heard of the Lane Regional Air Protection Agency, consistent with 70% in 2001 but up from 55% in 1997. 27% have not heard of the agency. 1% are unsure.
FUEL USE SURVEY
FOR LANE REGIONAL AIR PROTECTION AGENCY
October, 2009
PURPOSE OF THE STUDY
The purpose of this study is to assist LRAPA in determining patterns of fuel usage.
METHODOLOGY
Advanced Marketing Research was hired to conduct the research project in order to obtain unbiased and statistically valid results.
Using questions proposed by LRAPA, Advanced Marketing Research designed a questionnaire instrument to be administered by telephone. Using a random list of Eugene/Springfield area residents as a sampling frame, 404 interviews were completed. Telephone interviews were conducted between October 9 and October 18, 2009.
Proper data analysis techniques were employed by Advanced Marketing Research to avoid introducing unnecessary error and bias into the study.
QUOTAS OBSERVED
The residential population was sampled using the following quotas:
Males 45% to 55%
Females 45% to 55%
Age 65+ Not to exceed 25%
RESPONSE RATE
Of the 492 qualified respondents reached by telephone, 404 interviews were completed, for a response rate of 82%. The overall breakdown of numbers dialed is as follows:
Refusals 88
Disconnects 46
Wrong Numbers 5
Language Barrier 4
Spanish Language Barrier 6
Business Numbers 16
Fax 17
No Answer 65
Answering Machine 498
Busy Signal 14
Call Backs 13
Respondent Not Available 6
Completed Interviews 404
Total Numbers Dialed 1,182
TESTS FOR DIFFERENCES BETWEEN PROPORTIONS
When looking at the data tables, differences between percentage amounts can be misleading, and statistical tests must be conducted to determine if the differences are statistically significant. The computer makes these calculations for us, and the results are occasional plus or minus signs at the bottom of certain cells. These indicate that those answers are more different from everybody else’s answers than could be expected due to chance, given the sample sizes involved. Plus signs are used if the group picks that answer more often than everyone else; minus signs if it is less than everyone else. The number of plus or minus signs indicates the level of statistical significance. One means the 90% level, two the 95% level, and three the 99% level. For example, two plus signs would mean that you can be 95% sure that the people represented by that group really would pick that answer more often than the people represented by the rest of the sample. It should be noted that this test can only be done for banner columns that contain at least 30 people. Because of this requirement, it is possible that the test will be done for some banner columns on a table and not for others.
NOTES ON CHI SQUARE
The chi square value and its associated probability are printed beneath the first column in each banner heading. The probability (p=.xxx) indicates the probability that the heading and row variables are not related is .xxx. For example, a .05 probability of not being related means a 95 percent chance of being related.
DEMOGRAPHIC CHARACTERISTICS OF THE SAMPLE (Q20-24)
Gender 2009 2001
Male 50% 47%
Female 50 53
Age
18-24 3% 8%
25-34 7 16
35-44 21 20
45-54 20 16
55-64 27 20
65+ 21 18
Residence
Eugene 67% 78%
Springfield 33 22
Own or Rent
Own 91% 76%
Rent 9 24
BOUND ON ERROR
SAMPLE SIZE Bound on Error at
SEX Frequency Percent 95% Confidence Level
Male 200 50% 6.4%
Female 204 50% 6.3%
AGE
18-24 14 3% --
25-34 27 7% --
35-44 85 21% 9.7%
45-54 79 20% 10.1%
55-64 108 27% 8.6%
65+ 86 21% 9.7%
RESIDENCE
Eugene 272 67% 5.5%
Springfield 132 33% 7.8%
OWN/RENT
Own 366 91% 4.7%
Rent 38 9% 14.6%
TOTAL 404 100% 4.5%*
* What this means is that we are 95% certain that the mean response of the entire population of
Eugene/Springfield area residents lies within (plus or minus) 4.5% of the survey response.
MINIMUM DIFFERENCE IN PERCENTAGE POINTS REQUIRED FOR
STATISTICAL SIGNIFICANCE IN COMPARISON OF REPORTED
PERCENTAGES FOR SUBGROUPS WITH 95% CONFIDENCE
Subsample 50 100 150 200 250 300 350 400 450 500 600
50 20% 17% 16% 15% 15% 15% 15% 15% 15% 15% 15%
100 14% 13% 12% 12% 11% 11% 11% 11% 11% 11%
150 11% 11% 10% 10% 10% 9% 9% 9% 9%
200 10% 9% 9% 9% 8% 8% 8% 8%
250 9% 8% 8% 8% 8% 8% 7%
300 8% 8% 7% 7% 7% 7%
350 7% 7% 7% 7% 6%
400 7% 7% 7% 6%
450 7% 6% 6%
500 6% 6%
600 6%
Minimums are for reported percentages near 50%. When much smaller or much larger percentages are reported, a slightly smaller minimum is required.
ANALYSIS OF DATA
PRIMARY HEAT SOURCE (Q3-4)
Natural gas forced air heaters and electric heat pumps top the list as primary sources of heat for Eugene/Springfield area residents, with 25% each. Electric ceiling heat and electric wall heaters are each the primary source of heat for 13%, and electric forced air is the source of heat for 12%.
The electric heat pump has moved up from 8% in 2001 to 25% currently, while electric ceiling heat has gone from 33% and first place in 2001, down to 13% currently.
Demographic Differences
Homeowners and Eugene residents are more likely than others to have natural gas forced air as their primary source of heat. Homeowners are more likely than renters to have an electric heat pump. Renters are more likely than owners to have electric ceiling heat or electric wall heaters as their primary sources of heat.
SECONDARY HEAT SOURCES (Q5-6)
43% of residents do not have a secondary source of heat, down from 56% in 2001. 16% use a wood fireplace as a secondary source of heat, 8% use a gas fireplace, 8% use electric wall heaters, and 8% use wood stoves.
Demographic Differences
35 to 44 year-olds and renters are more likely than others to not have a secondary source of heat in their household. 55 to 64 year-olds are more likely than others to use a wood fireplace as a secondary source of heat. Eugene residents are more likely than Springfield residents to use a gas fireplace or an electric wall heater as a secondary source of heat. Males are more likely than females to use a wood stove as a secondary source of heat.
CHANGES IN PRIMARY HEAT SOURCE (Q7-10)
7% are considering a change in their primary heat source, consistent with 6% in 2001. Of those considering a change (n=29), 66% are planning to switch to an electric heat pump (up from 23% in 2001), 10% are planning to get electric forced air, and 3% are planning to get gas forced air (down from 27% in 2001).
For those considering a switch (n=29), cost is the reason for 38%, efficiency is the reason for 31%, and 24% don’t like their current system. (See Table 10V for verbatim responses.)
CURRENT USE OF WOOD STOVES (Q11-13)
18% of residents currently have a wood stove, consistent with 15% in 2001. 44% of the wood stoves are over fifteen years old. 11% are eleven to fifteen years old, 25% are five to ten years old, and 11% are less than five years old. 8% of the wood stoves are of unknown age.
Of those with wood stoves (n=72), 10% do not use them at all. 42% burn less than one cord per year, 22% burn one to two cords per year, and 22% burn three or more cords each year. 4% are unsure how much wood they burn.
Demographic Differences
55 to 64 year-olds are more likely than others to have a wood stove.
CURRENT USE OF PELLET STOVES (Q14-16)
7% of residents currently have a pellet stove, consistent with 3% in 2001. 27% of the pellet stoves are under five years old, down from 55% in 2001. 43% are five to ten years old, 13% are eleven to fifteen years old, and 13% are over fifteen years old. 3% of the pellet stoves are of unknown age.
Of those with pellet stoves (n=30), 7% do not use them at all. 23% burn 1 to 25 bags of pellets per year. 37% burn 26 to 50 bags per year. 20% burn 51 to 75 bags per year. 14% burn over 75 bags each year.
CURRENT USE OF WOOD-BURNING FIREPLACES (Q17-18)
31% of residents currently have a wood-burning fireplace, consistent with 37% in 2001.
Of those with wood-burning fireplaces (n=125), 42% do not use them at all, up from 29% in 2001. 47% burn less than one cord per year, 7% burn one to two cords per year, and 3% burn three or more cords each year. 1% are unsure how much wood they burn.
Demographic Differences
35 to 44 year-olds are less likely than others to have a wood-burning fireplace. Females are more likely than males to say they never use their wood-burning fireplace.
AWARENESS OF LRAPA (Q19)
72% have heard of the Lane Regional Air Protection Agency, consistent with 70% in 2001 but up from 55% in 1997. 27% have not heard of the agency. 1% are unsure.
Demographic Differences
55 to 64 year-olds are more likely than others to say they have heard of LRAPA. 18 to 34 year-olds are less likely than others to say they are familiar with the agency.